In November 2021, goods and services in the consumer market increased on average by 1.2%.
Since the beginning of this year, the increase in prices in the consumer sector accounted for 8.6%, in annual terms it reached 10.3%.
The leaders in the growth of prices and tariffs for the month in November 2021 were food products, which increased in price by an average of 1.9% over the month. Non-food products for the same period added in price by 0.8%, paid services to the population - by 0.5%.
In annual terms, food products in November 2021 rose in price by 13.4%, maintaining the leadership in price growth among the three main groups. Since November 2020, non-food products have increased in price by 7.9%, services - by 8.1%.
In general, for the period from the beginning of 2021, food products continue to hold the lead in price growth (10.8%). Non-food products for the specified period became more expensive by 7.0%, services - by 7.1%.
The share of the contribution of growth in food prices in the total increase in the consolidated CPI in January-November this year reached 52.9% of the total increase in the consolidated CPI (against 50.4% in January-October this year). Non-food products accounted for 28.0%, services - 19.1% of the total contribution of all goods and services covered by price monitoring.
CPI for food products
The increase in the CPI for food products in November of the current year for the month was 1.9%. This is 0.5 points lower than in November 2020 and 1.1 points lower than in November 2019.
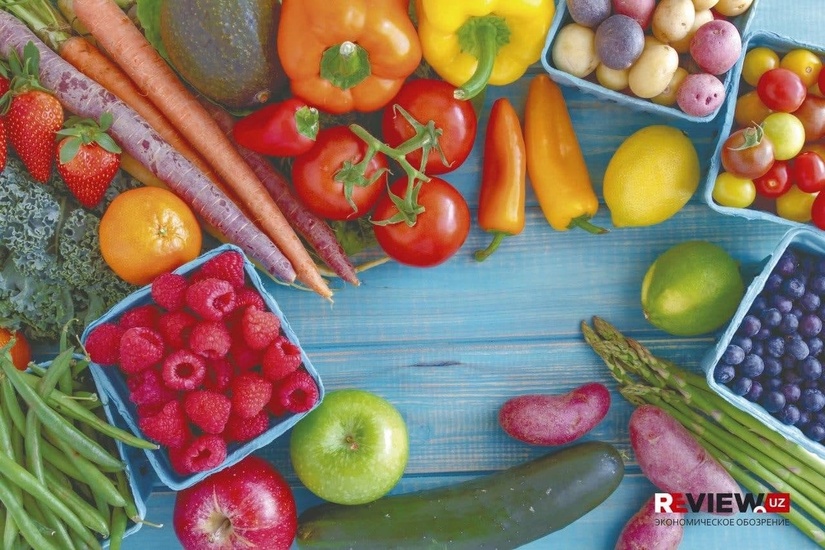
In November 2021, tomatoes (1.5 times) and bell peppers (1.4 times) became the leaders in the growth of prices for the month from fruit and vegetable products. Cucumbers and eggplants (1.3 times), as well as cabbage (15.8%), garlic (13.7%) and potatoes (10.0%) have significantly increased. Carrots (-24.9%), turnips (-8.3%), radishes (-7.0%), beets (-5.2%), lemons (-4.4 %) and bananas (-3.5%). Carrots continue to hold the lead in terms of price growth both from the beginning of the year and in annual terms (1.7 times).
The growth in the annual CPI in this group in November 2021 was at the level of 13.4%. This is, respectively, 2.9 and 5.0 points lower than the same indicator for November 2020 and 2019. In general, in January-November 2021, food prices increased by 10.8%, which is 1.8 points lower than in the corresponding period of 2020, and 4 points lower than in January-November 2019.
CPI for non-food products
The increase in the CPI for non-food products in November this year amounted to 0.8% over the month. This is 0.2 points higher than the average monthly growth for January-November 2021, 0.1 points lower than in November 2020 and is equivalent to the corresponding indicator for November 2019.
The increase in the annual CPI in this group in November 2021 was recorded at around 7.9%, which is 0.4 points lower than in November last year and 3.9 points lower than in November 2019. Relative to December 2020, non-food products became more expensive by 7.0%, which is 0.8 points lower than in January-November last year, and 3.4 points lower than in the same period in 2019.
CPI for paid services
The increase in the CPI for paid services in November this year amounted to 0.5% for the month. This is 0.4 points lower than last November, and 0.1 points lower than the same indicator for November 2019.
The growth in the annual CPI in this group in November 2021 was 8.1%, which is 1.6 points higher than in November last year and 8.2 points lower than in November 2019. Since the beginning of 2021, paid services to the population have become more expensive by 7.1%. This, in turn, is 1 point higher than in January-November 2020, and 7.8 points lower than in the same period in 2019.
Of the main product groups in this section, the top three in terms of price growth in January-November 2021 included fat and oil products (25.8%), vegetables, tubers, plantains and legumes (13.6%), as well as sugar, confectionery. products and desserts (13.0%).
The listed groups are also leading in terms of price growth in annual terms. Thus, fat and oil products, compared to November 2020, became more expensive by 28.6%, vegetables, tubers, plantains and legumes - by 23.8%, sugar, confectionery and desserts - by 14.7%.


leave a comment