The business activity index in June 2020 moderately increased by 6.8%
The Center for Economic Research and Reforms of Uzbekistan conducted a Business Activity index.

In June 2020, the Business Activity Index (BAI), calculated by the Center for Economic Research and Reform, showed the following:
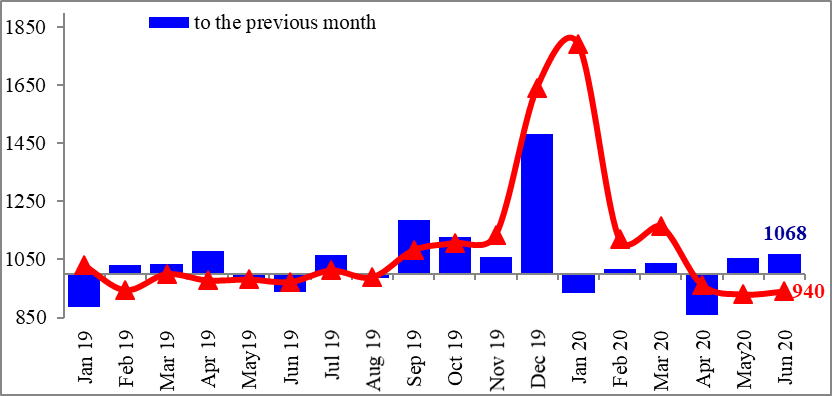
In June of 2020, the index of business activity showed a moderate increase compared to the previous month. Business activity in the economy, as in the previous month, continues to recover. Whereas the values of BAI, as compared to the same month of last year, remains at a low level (-6.0%).
Figure 1. BAI in June 2020 years has increased to 6, 8 %, compared with the previous month
Changes were observed in the components of the BAI.
The business activity index in June 2020 moderately increased by 6.8% and amounted to 1068 points, compared with the previous month, which is explained by the changes in the following components:
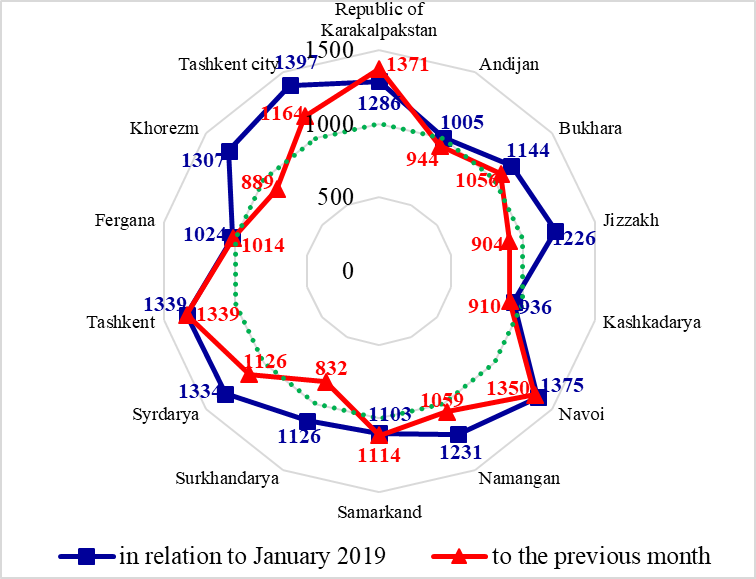
In the regional context, the Republic of Karakalpakstan showed the highest growth.
In June 2020, the Business Activity Index for nine regions increased compared to the previous month (May 2020). In Karakalpakstan (37. 1 %), Navoi (35.0%), Tashkent (33.9%) region and Tashkent (16.4% ) significant growth rates were observed ( see. Fig. 2).
In addition, in Surkhandarya (16.8%), Khorezm (11.1%), Jizzakh (9.6%), Kashkadarya (9.0%) and Andijan regions, there were a decline compared to the previous month.
Figure 2. Business activity index by regions of the Republic of Uzbekistan in June 2020
OPERATIONS WITH BANK ACCOUNTS
The number of interbank transactions in June 2020 amounted to 4071,7 thousand and increased to 15.9 thousand transactions (0.4 %), in comparison with May 2020 year. Compared to the same period of the last year, there was 26.6 % decline. This indicates that the coronavirus pandemic still has negative impact on the entrepreneurship activity.
Based on the number of banking operations Tashkent has demonstrated the highest rate.
In June 2020 in many regions the number of banking transactions between legal entities has declined, compared to the previous month, except Tashkent ( + 9.7% ), Syrdarya ( + 5.1% ) and Samarkand ( +2.6% ) regions. The most significant decline was observed in Jizzakh (- 20.3%), Navoi (- 15.1%), Surkhandarya (- 13.7%) and Khorezm (- 13.4%) regions.
ACTIVITY ON COMMODITY EXCHANGE
In June 2020, the exchange component of the BAI amounted to 0.942, which means a decrease in the level of the component by 5.8%, compared with the previous month. The decline in the level of this component is associated with a reduction in the average volume of goods purchased for each transaction, by 21.7%.
According to the results of June, Republican commodity exchange registered 26525 transactions that is 2443 transactions more (10.1%) than in May this year (24082). The total turnover of the commodity exchange in June 2020 amounted to 4591.8 billion soums, which is 37.8% more compared to the previous month.
ACTIVITY OF ECONOMIC SUBJECTS
The component of operating economic entities in June 2020 amounted to 1.0081, which means an increase in the component by 0.8% compared to the previous month.
Number of active business entities in June 2020 has increased to 8154 units compared to May 2020 (464300 points) and amounted to 472454 points.
The number of large enterprises decreased by 53 points.
During the reporting period, the number of small businesses increased from 362583 to 370358 units (increase in 7775 units). The number of farms increased from 98655 to 99087 units (by 432 units). The number of large operating enterprises amounted to 3009 units that is 53 units less compared to May 2020.
BRAND REGISTRATION
In June 2020, the index of protected trademarks was equal 3.9286, which means an 3.9 times increase in comparison with the previous month. Legal entities registered 165 trademarks and trade names.
| Regions |
BAI | Component on operations’ accounts | Exchange component of index | Operating entities component | Trade mark component |
| Republic of Karakalpakstan | ↑1371 | ↓0,9889 | ↑2,0000 | ↑1,0212 | ↓0,0000 |
| Navoi | ↑1350 | ↓0,8492 | ↑2,0000 | ↑1,0105 | ↑1,0000 |
| Tashkent region | ↑1339 | ↓0,9724 | ↓0,9623 | ↑1,0151 | ↑13,0000 |
| Tashkent | ↑1164 | ↑1,0969 | ↑1,1130 | ↑1,0007 | ↑3,8387 |
| Syrdarya | ↑1126 | ↑1,0507 | ↑1,2721 | ↓0,9993 | ↑1,0000 |
| Samarkand | ↑1114 | ↑1,0256 | ↑1,0230 | ↑1,0262 | ↑4,0000 |
| Namangan | ↑1059 | ↓0,9348 | ↑1,1194 | ↑1,0187 | ↑2,0000 |
| Bukhara | ↑1056 | ↓0,9343 | ↓0,8146 | ↑1,0125 | ↑6,0000 |
| Fergana | ↑1014 | ↓0,9797 | ↑1,0470 | ↑1,0111 | ↑1,0000 |
| Andijan | ↓944 | ↓0,9036 | ↓0,8994 | ↑1,0141 | ↑1,5000 |
| Kashkadarya | ↓910 | ↓0,9249 | ↓0,9133 | ↑1,0057 | ↓0,0000 |
| Djizakh | ↓904 | ↓0,7971 | ↓0,9665 | ↑1,0163 | ↓0,5000 |
| Khorezm | ↓889 | ↓0,8659 | ↓0,9151 | ↑1,0007 | ↓0,0000 |
| Surkhandarya | ↓832 | ↓0,8634 | ↓0,7123 | ↓0,9777 | ↑1,0000 |
Table 1. Changes in BAI components by region to the previous month
| Regions |
BAI | Component on operations’ accounts | Exchange component of index | Operating entities component | Trade mark component |
| Tashkent | ↑1397 | ↓0,9397 | ↑1,9249 | ↑1,1730 | ↑1,3523 |
| Navoi | ↑1375 | ↓0,6463 | ↑2,0000 | ↑1,4494 | ↑1,0000 |
| Tashkent region | ↑1339 | ↓0,6766 | ↑2,0000 | ↑1,1750 | ↑1,4444 |
| Syrdarya | ↑1334 | ↓0,6558 | ↑2,0000 | ↑1,2463 | ↑1,0000 |
| Khorezm | ↑1307 | ↓0,6919 | ↑2,0000 | ↑1,2053 | ↓0,0000 |
| Republic of Karakalpakstan | ↑1286 | ↓0,6568 | ↑2,0000 | ↑1,1639 | ↓0,0000 |
| Namangan | ↑1231 | ↓0,7000 | ↑1,7695 | ↑1,2185 | ↓0,3333 |
| Djizakh | ↑1226 | ↓0,6921 | ↑1,6223 | ↑1,3837 | ↑1,0000 |
| Bukhara | ↑1144 | ↓0,6460 | ↑1,1624 | ↑1,2428 | ↑6,0000 |
| Surkhandarya | ↑1126 | ↓0,7191 | ↑1,3583 | ↑1,3688 | ↑1,0000 |
| Samarkand | ↑1103 | ↓0,6299 | ↑1,1605 | ↑1,3540 | ↑4,0000 |
| Fergana | ↑1024 | ↓0,6748 | ↑1,2702 | ↑1,2030 | ↓0,5000 |
| Andijan | ↑1005 | ↓0,7423 | ↑1,0345 | ↑1,0966 | ↑3,0000 |
| Kashkadarya | ↓936 | ↓0,6866 | ↑1,1162 | ↑1,1316 | ↓0,0000 |
Table 2. Changes in BAI by regions to the base period (January 2019 y.)


leave a comment