In February 2021, the Business Activity Index (BAI), calculated by the Center for Economic Research and Reforms, amounted to 1,034 points, compared to the corresponding month of the previous year and increased by 3.4%.
The Business Activity Index showed growth both in relation to the previous month and to the same month last year.
Figure 1. BAI in February 2021 increased by 9.9% compared to the previous month
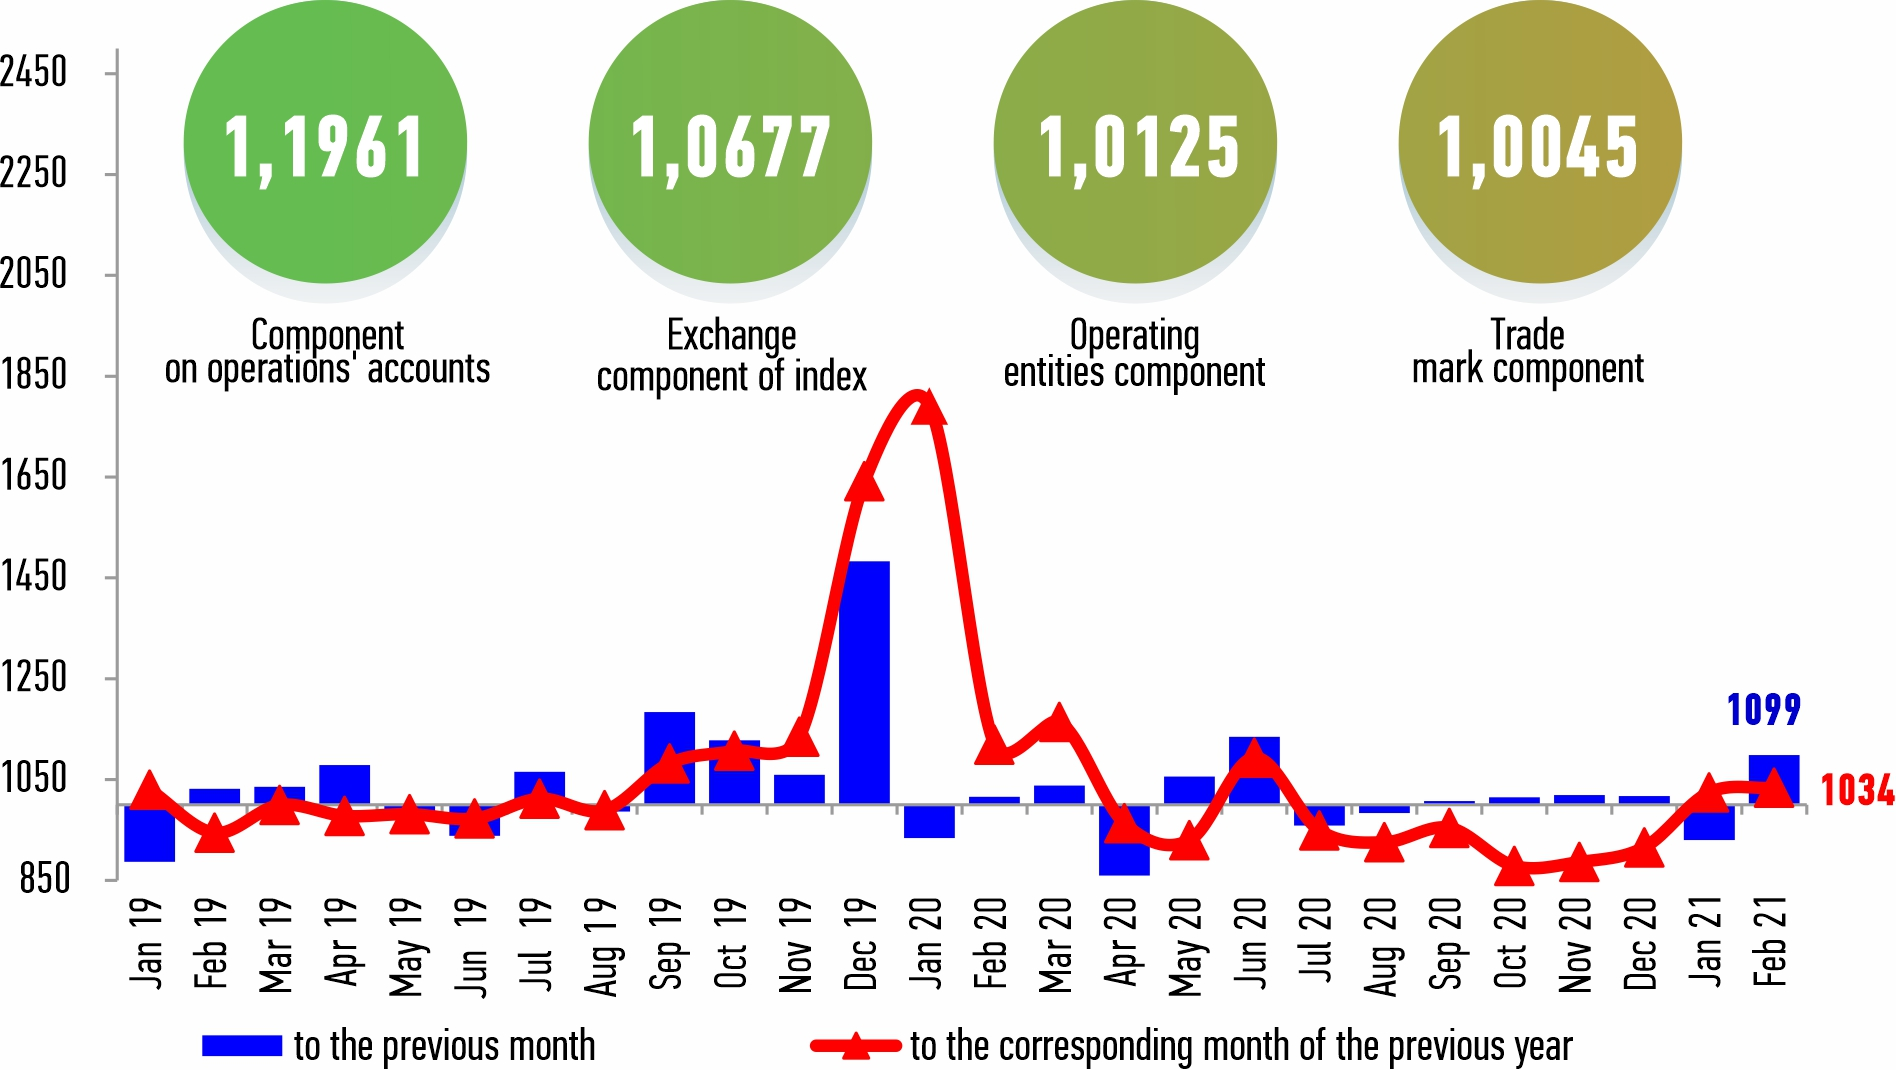
Various changes were observed in the components of the BAI
The business activity index in February 2021 increased by 9.9% and amounted to 1,099 points, compared to the previous month, which is explained by changes in the following components:
- the number of transactions on bank accounts of business entities increased by 19.6%;
- the component of operating economic entities increased by 1.3%;
- the intensity of purchasing raw materials at the commodity and raw materials exchange increased by 6.8%;
- the component of trade marks increased by 0.5%.
In the regional concept, the Fergana region showed the highest growth
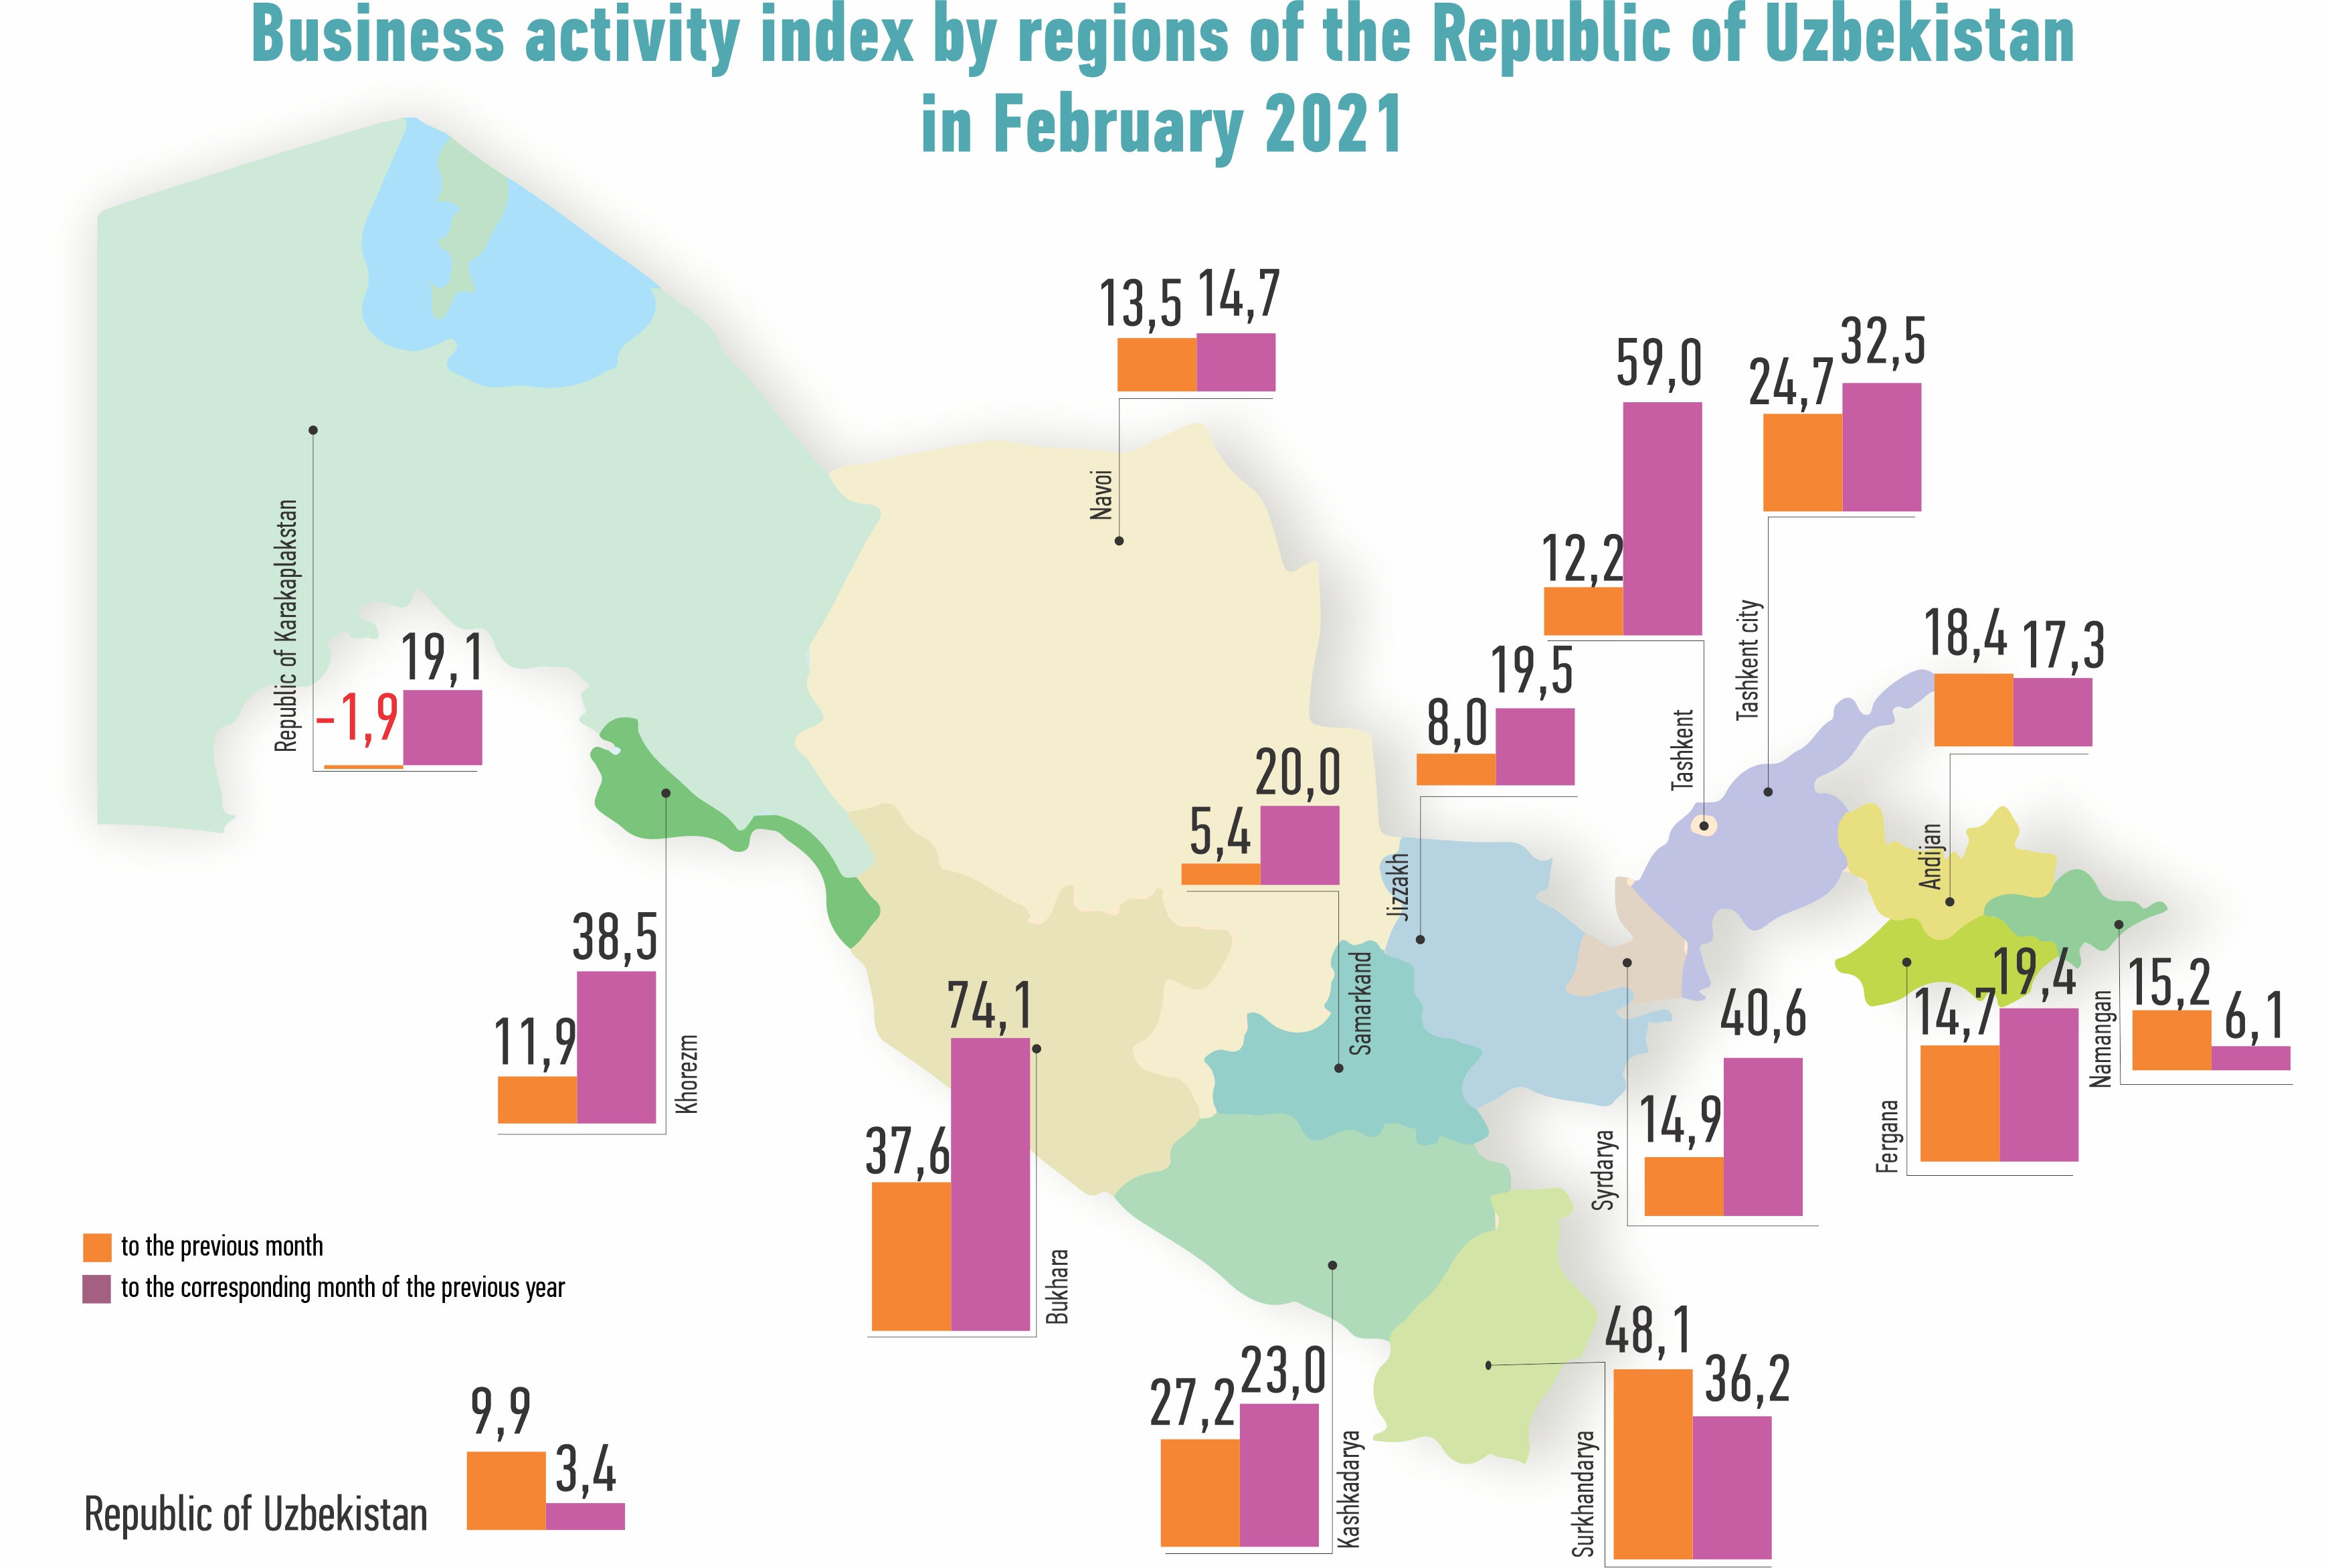
In February 2021, the Business Activity Index for 11 regions increased compared to the previous month (January 2021). In Fergana (51.3%), Bukhara (44.1%), Samarkand (35.2%) and the Republic of Karakalpakstan (34.5%), there was a significant increase (Fig. 2).
Figure 2. Business activity index by regions of the Republic of Uzbekistan in February 2021
OPERATIONS WITH BANK ACCOUNTS
The number of interbank payment transactions in February 2021 amounted to 4,362.9 thousand and increased by 715.4 thousand transactions (19.6%) compared to January 2021.
The number of banking operations in all regions has increased.
In February 2021, the number of banking transactions between legal entities, compared to the previous month, increased in all 14 regions. In particular, the most significant growth was observed in Khorezm (26.9%), Kashkadarya (26.5%), Syrdarya (24.0%), Jizzakh (23.6%) and Navoi (23.5%) regions.
ACTIVITY ON COMMODITY EXCHANGE
In February 2021, the exchange component of the BAI was 1.0677, which means an increase in the component level by 6.8% compared to the previous month. The increase in the component level is associated with an increase in the number of transactions by 20.8%.
At the Republican Commodity and Raw Materials Exchange, the total turnover in February 2021 amounted to 4.861.7 billion soums, which is 18.5% more than in the previous month.
ACTIVITY OF ECONOMIC ENTITIES
The component of operating economic entities in February 2021 amounted to 1.0125, which means an increase in the component by 1.25% compared to the level of the previous month.
The number of operating economic entities in February 2021 increased by 7,338 units compared to January 2021 (524,136 units) and amounted to 531,474 units.
The number of large enterprises increased by 26 units
During the reporting period, the number of small businesses increased from 417,244 to 423,511 units (an increase of 6,267 units). The number of farms increased from 103,900 to 104,945 (an increase of 1,045). The number of operating large enterprises amounted to 3,018 units, which is 26 units more than in January 2021.
BRAND REGISTRATION
In February 2021, the index of protected trademarks was 1.0045, which means an increase of 0.5% compared to the previous month. In February of this year, legal entities registered 225 trademarks and trade names.
Table 2. Changes in BAI components by region to the previous month
| Regions |
BAI | Component on operations’ accounts | Commodity exchange component of index | Operating entities component | Trade mark component |
| The Republic of Uzbekistan | ↑1099 | ↑1,1961 | ↑1,0677 | ↑1,0125 | ↑1,0045 |
| Syrdarya region | ↑1490 | ↑1,2396 | ↑1,9342 | ↑1,0105 | ↑2,0000 |
| Surkhandarya region | ↑1481 | ↑1,2255 | ↑2,0000 | ↑1,0110 | ↑1,0000 |
| Bukhara region | ↑1376 | ↑1,1830 | ↑1,6030 | ↑1,0157 | ↑3,2500 |
| Kashkadarya region | ↑1272 | ↑1,2645 | ↑1,4345 | ↑1,0253 | ↑1,0000 |
| Tashkent region | ↑1247 | ↑1,1763 | ↑1,4226 | ↑1,0071 | ↑1,5000 |
| Andijan region | ↑1184 | ↑1,1783 | ↑1,2235 | ↑1,0102 | ↑2,0000 |
| Namangan region | ↑1152 | ↑1,1587 | ↑1,1293 | ↑1,0211 | ↑2,3333 |
| Fergana region | ↑1147 | ↑1,1945 | ↑1,2344 | ↑1,0107 | ↓0,4286 |
| Navoi region | ↑1135 | ↑1,2350 | ↑1,2015 | ↑1,0101 | ↓0,0000 |
| Tashkent city | ↑1122 | ↑1,1929 | ↑1,1390 | ↓0,9927 | ↑1,0126 |
| Khorezm region | ↑1119 | ↑1,2689 | ↓0,9788 | ↑1,0146 | ↑2,0000 |
| Jizzakh region | ↑1080 | ↑1,2362 | ↓0,9837 | ↑1,0166 | ↑1,0000 |
| Samarkand region | ↑1054 | ↑1,1661 | ↑1,0416 | ↑1,0183 | ↓0,1875 |
| Republic of Karakalpakstan | ↓981 | ↑1,1461 | ↓0,8999 | ↓0,9982 | ↓0,0000 |
Table 2. Changes in BAI by regions to the base period (February, 2020)
| Regions |
BAI | Component on operations’ accounts | Commodity exchange component of index | Operating entities component | Trade mark component |
| The Republic of Uzbekistan | ↑1034 | ↓0,8026 | ↑1,0555 | ↑1,2158 | ↑2,1028 |
| Bukhara region | ↑1741 | ↓0,8168 | ↑2,0000 | ↑1,2043 | ↑13,0000 |
| Tashkent city | ↑1590 | ↑1,1288 | ↑1,3161 | ↑2,7878 | ↑1,8295 |
| Syrdarya region | ↑1406 | ↓0,6607 | ↑2,0000 | ↑1,1585 | ↑4,0000 |
| Khorezm region | ↑1385 | ↓0,7725 | ↑2,0000 | ↑1,1596 | ↑2,0000 |
| Surkhandarya region | ↑1362 | ↓0,7668 | ↑1,9795 | ↑1,2367 | ↑1,0000 |
| Tashkent region | ↑1325 | ↓0,6747 | ↑2,0000 | ↑1,1529 | ↑1,1667 |
| Kashkadarya region | ↑1230 | ↓0,6726 | ↑1,7369 | ↑1,2271 | ↑1,0000 |
| Samarkand region | ↑1200 | ↓0,8407 | ↑1,3144 | ↑1,3171 | ↑3,0000 |
| Jizzakh region | ↑1195 | ↓0,6947 | ↑1,5797 | ↑1,3158 | ↑1,0000 |
| Fergana region | ↑1194 | ↓0,7732 | ↑1,3175 | ↑1,1880 | ↑4,5000 |
| Republic of Karakalpakstan | ↑1191 | ↓0,7087 | ↑1,7033 | ↑1,1870 | ↓0,0000 |
| Andijan region | ↑1173 | ↓0,6351 | ↑1,5726 | ↑1,1910 | ↑2,0000 |
| Navoi region | ↑1147 | ↓0,8545 | ↑1,4623 | ↑1,1940 | ↓0,0000 |
| Namangan region | ↑1061 | ↓0,7266 | ↑1,2627 | ↑1,2133 | ↑1,1667 |





leave a comment